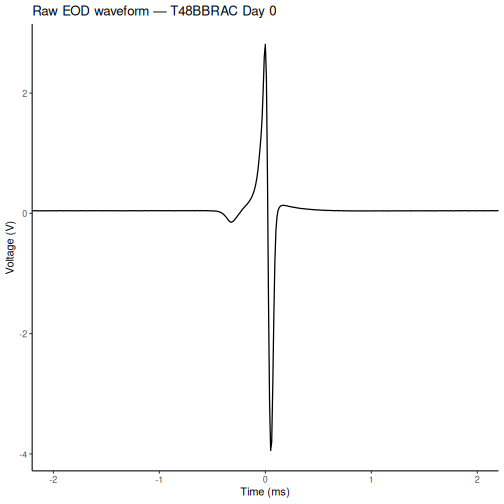
Image 1 of 1: ‘Line plot of a single EOD waveform showing voltage in volts on the y-axis and time in milliseconds on the x-axis. The waveform has a characteristic biphasic shape with a positive P1 peak followed by a negative P2 trough.’
A single raw EOD waveform recorded from B. brachyistius. The
biphasic waveform is characteristic of mormyrid electric fish.
Figure 2
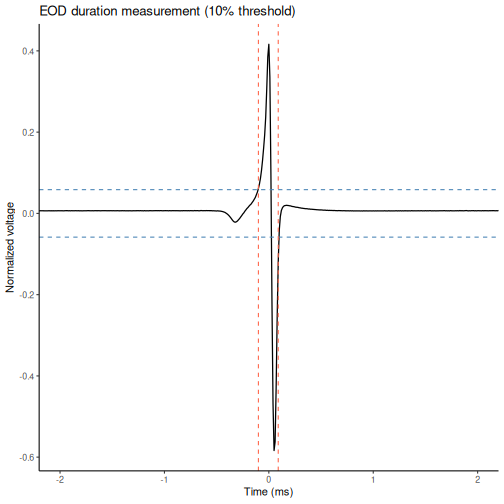
Image 1 of 1: ‘Normalized EOD waveform with horizontal dashed lines at +10% and -10% of the peak amplitude. Vertical dashed lines mark the measured start and end of the EOD, highlighting the duration window.’
Threshold-based EOD duration measurement on the normalized waveform.
Figure 3
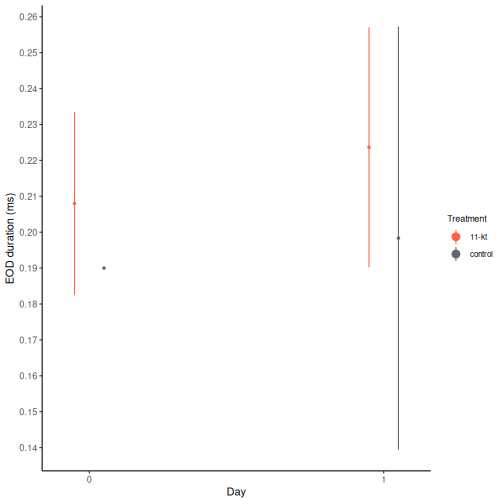
Image 1 of 1: ‘Line plot showing mean EOD duration in milliseconds on the y-axis and experimental day on the x-axis, with separate colored lines for the 11-kt and control groups. Error bars represent one standard deviation.’
Mean EOD duration (±SD) across experimental days by treatment group.